User Guide
Explore How Our I RISE UP App is Revolutionizing Local Disaster Risk Reduction.
UNDERSTANDING THE PARAMETERS
Data Parameters Analyzed and Displayed in the System
The IRISEUP System is a consolidation of the latest technology from Quezon City Disaster Risk Reduction & Management Office. The system is powered by the best local datasets from sensors, earth observation satellites, artificial intelligence (AI) and local community data.
Rain, wind, and temperature are fundamental weather parameters that provide essential information about atmospheric conditions in a specific location.
Rainfall measures the amount of precipitation in millimeters (mm). Wind speed (kph) and direction determine the movement and intensity of air masses. Air temperature is a measure of how hot or cold the air is, which measures in degrees Celsius (DegC).
This system provides observation data of these three parameters in Quezon City such as past (1-hr, 6-hr, 24-hr), current, and forecast (6-hr, 24-hr). Understanding and monitoring these parameters help us prepare for weather changes and make science-based decisions.
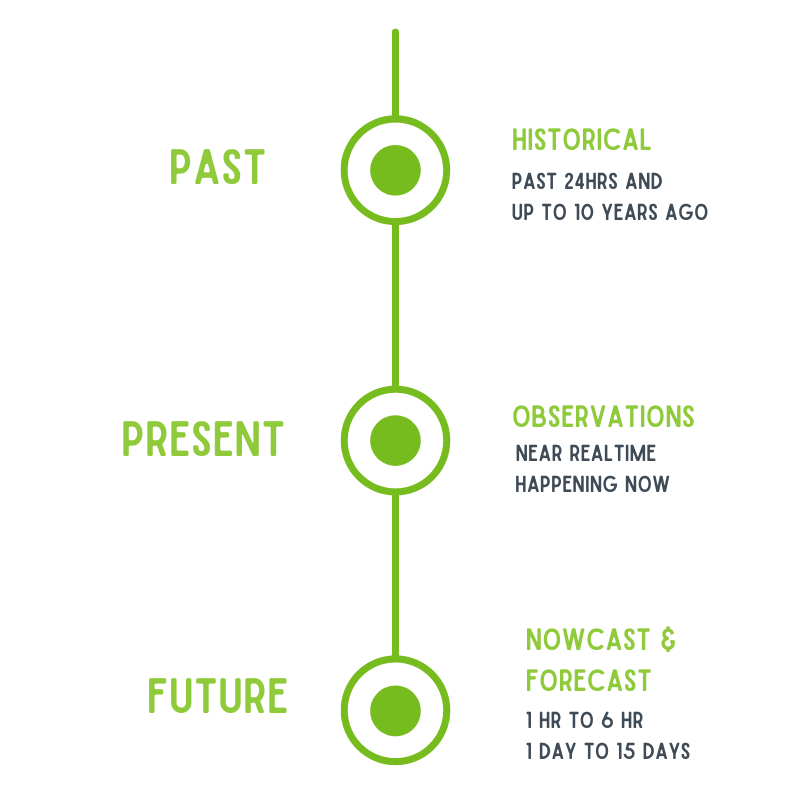
Timeline: Historical, Observations, Nowcast, Forecast
Source: Automated Weather Stations, Rain Gauge, Micro Radars, and Komunidad AI Models
Low-Pressure Areas (LPA) and Tropical Cyclones (TCs) are atmospheric systems that can affect weather conditions in a specific region, i.e., in the Philippines.
A Low-Pressure Area (LPA) is an area where the air pressure is lower than its surroundings. It can cause unstable weather like cloudy weather, heavy rains, and sometimes severe thunderstorms.
Tropical Cyclones, on the other hand, are intense low-pressure systems that form over warm tropical or subtropical waters. They have strong winds that rotate around a center. It can bring heavy rains, strong winds, and dangerous conditions, such as flooding and landslides.
The system provides the precise location, forecast track, and intensity of LPAs, forecast cone, or TCs based on the latest information from the sources. It provides the distance between a weather system and a barangay in Quezon City. Understanding these systems helps us prepare and stay safe during extreme weather events.
Timeline: Historical, Observation, Forecast
Source: PAGASA, JMA, JTWC
Lightning is a powerful electric spark that happens in the sky during a thunderstorm. A thunderstorm is a type of cloud that includes rain and lightning. Thunderstorms can be dangerous. Lightning occurs during every thunderstorm. To help the people of Quezon City stay safe and make informed decisions, IRISE-UP uses data from Vaisala. Vaisala provides accurate information about lightning and thunderstorms in Quezon City through their reliable lightning detection networks, visualization tools, and network management.
Timeline: Observation
Source: Vaisala
Measuring water levels is vital in preventing flooding. Water level monitoring plays a crucial role in providing an early warning system by giving advance notice of potential flood situations. This advanced warning allows for valuable time to protect assets, relocate valuables, and safeguard properties. The Quezon City has implemented five flood sensors in strategic locations including North Fairview, Batasan-San Mateo, Congressional, Quezon Avenue, and Katipunan. These sensors provide access to both historical and real-time water level data in these critical areas, enabling Quezon City to effectively monitor and respond to flood risks.
Timeline: Historical and Observation
Source: Flood Sensors
Measuring air quality is essential for Quezon City as it helps ensure the well-being of its residents. By monitoring the quality of the air they breathe, the city can identify pollutants and harmful substances in the atmosphere. This valuable information, sourced from Komunidad AI Models, provides a timeline of historical, observed, and forecasted data. With this data, Quezon City can make informed decisions and implement effective strategies to reduce pollution, improve air quality, and protect its residents from potential health risks such as respiratory problems and allergies. Taking proactive measures based on accurate air quality measurements, Quezon City strives to create a cleaner and safer environment for all its residents to enjoy.
Timeline: Historical, Observation, Forecast
Source: Komunidad AI Models
An earthquake is a quick movement of rock materials under the earth’s surface that causes the ground to shake violently or weakly. The system provides observation data in Quezon City’s earthquake events in specific real time and date through the use of Earthquake Sensors. The data also shows the sensor name, observation time, current, past (1-hr), and past (6-hr) wherein each sensor has a table to plot the said parameters.
Timeline: Observation
Source: Earthquake Sensor
Mosquito Activities can have a lifestyle impact on our daily lives. Mosquitoes are notorious for their bites and ability to transmit vector-borne diseases such as Dengue or Malaria.
In this system, mosquito activity is under the lifestyle impact in the system. It provides the severity of mosquito activity in a specific location in Quezon City. It has observed and forecasted the activity of mosquitoes in the next hours and days. Monitoring the activities of mosquitoes is essential to minimize lifestyle disruptions and prevent transmission of diseases.
Timeline: Observation and Forecast
Source: Komunidad AI Models
The status of already existing Evacuation Centers in Quezon City can be accessed in the system. Its real time observation data from the QCDRRMO is also further localized by displaying evacuation centers that vary from Barangay Halls, Barangay Buildings, Covered Courts, Open Spaces, Schools, up to Private Properties. Depending on the size of these centers, the capacity displays the numerical amount of what the venue can cater in times of emergency. The status, on the other hand, serves as a guide if the specific evacuation center is on standby, occupied, semi-full, or full.
Timeline: Observation
Source: QCDRRMO
UNDERSTANDING THE COLORS
Color Coded Threat Indicators
The IRISEUP System is a consolidation of the latest technology from Quezon City Disaster Risk Reduction & Management Office. The system is powered by the best local datasets from sensors, earth observation satellites, artificial intelligence (AI) and local community data.

UNDERSTANDING THE TIMELINE
Timeline Terminologies
The system provides data and analysis based on specific timelines.

WEB APP
How to View Barangay Risk Analysis & Early Warnings
From the ‘Home‘ panel where the Barangay Risk Assessment is displayed, the Barangay option in the Risk Analysis dropdown will present the different barangays in Quezon City together with their specific risk assessment and early warnings.
This Page Option bar is used to navigate the web app pages. This page option offers two different web pages namely ‘Dashboard’ and ‘Synoptic’.
This Dashboard Option is used to navigate on what Dashboard, between ‘Observed’ and ‘Forecast, the user wants to view.
The Parameter Option is used to choose a particular weather parameter that you want to reflect on the maps.
The Observed Dashboard displays the in-depth and specific information on how significant the current weather is in a specific barangay.
The Forecast Dashboard displays the expected weather of a certain barangay. It includes information regarding the currently experienced weather, the expected forecast for the next six (6) hours, and other weather parameters data that are dependent on the defined day in ‘Day Option’.
The Day Option is used to display the forecast days that the user wants to view in the portal.
The Synoptic Page presents the brief summary of the weather within the chosen barangay and forecast days.
The Synoptic Dashboard includes the sections of Weather Synopsis, Call-to-Action, and Weather Forecast. Other than displaying a brief summary of the weather forecast, these sections also present the specific recorded value of weather parameters and the suggestive actions to be made in the localized chosen barangay.
This Day Option bar is focused on the forecast days that the user wants to view in the Synoptic Dashboard.

WEB APP
How to View Citywide & Nationwide Analysis
The Local and National Option in the Risk Analysis dropdown will present the different barangays in Quezon City together with their specific risk assessment and early warnings, and national option.
This Dashboard Option is used to navigate on what Dashboard, between ‘Observed’ and ‘Forecast’, the user wants to view. The Parameter Option is used to choose a particular weather parameter that you want to reflect on the maps.
This Warning Type Option is used to choose a particular warning that will reflect on the maps/tables/graphs.
This Map View, you can see in-depth information on how significant the current/forecasted weather in a specific barangay is.
This Table View presents locations and a parameter with its warning levels.
The Observed Dashboard displays the in-depth and specific information on how significant the current weather is in a specific barangay.
This Warning Type Option is used to choose a particular warning that will reflect on the maps/tables/graphs.
This Map Type is used to select map tile visualizations based on user’s preference.
This Map View, you can see in-depth information on how significant the current/forecasted weather in a specific barangay is.
This Table View presents locations and a parameter with its warning levels.

WEB APP
How to View LPA & Tropical Cyclone Analysis and Evacuation Centers Status
The Location Option bar enables the user to choose between what type of location, between Barangay and National, is going to be displayed.
The Data Source Option displays data from three different weather agencies (both local and international) to provide insight on how close or risky the LPA or Tropical Cyclone is in barangay or national level.
The Map View enables the user to comprehend the distance and placement of the LPA or Tropical Cyclone being tracked within the Philippine’s Area of Responsibility.
This presents the forecasted movement of the LPA or Tropical Cyclone along with its details including date, wind speed, and wind gust.
Depending on the chosen Location Type, this table presents the distance of the specific locations from the LPA or Tropical Cyclone, along with their warning alert.
The Evacuation Center Page includes the location option bar to navigate on what location the user wants to check in terms of the available evacuation centers, the hazard option bar to choose what specific hazard is needed, and map option bar to choose a particular map which the user prefers to use.
The Map View highlights the chosen barangay with the plotted locations of the available Evacuation Centers depending on the inserted hazard type.
Beside the map is the table presenting the names of the specific evacuation centers in a certain barangay, along with the maximum capacity that they can cater.
The Evacuation Center Status page simply displays the real-time state of all listed evacuation centers within certain barangays in Quezon City. Depending on the size of these centers, the capacity displays the numerical amount of what the venue can cater in times of emergency. The status, on the other hand, serves as a guide if the specific evacuation center is on standby, occupied, semi-full, or full.
MOBILE APP
How to Login/Register
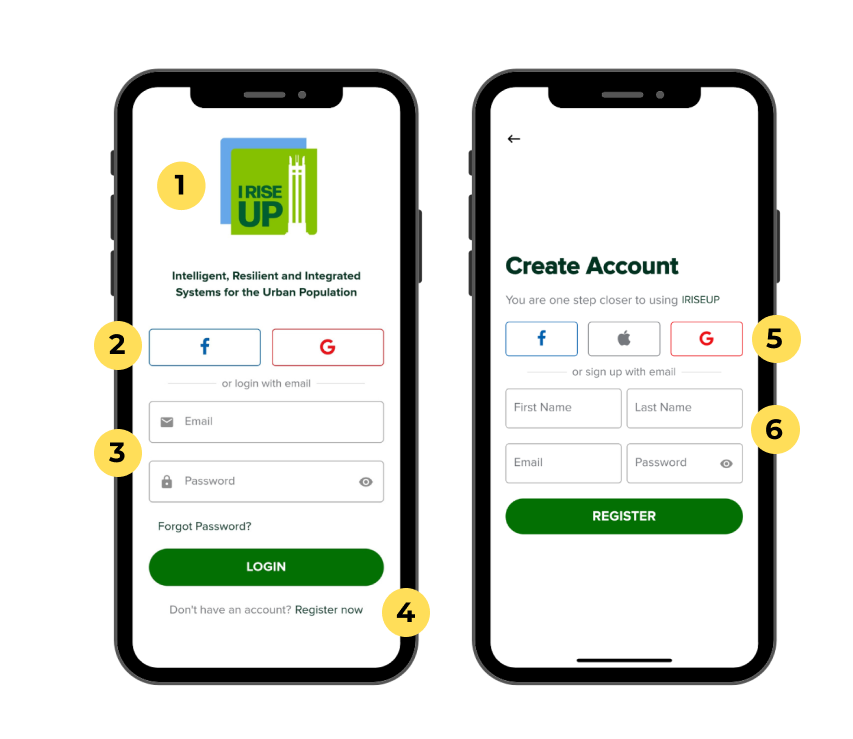
New App logo for the rebranded I RISE UP
Users can log-in with Facebook or Google authentication based on their preference
If the user has an existing account in the mobile application, they can input the email address and its password
If the user is not yet registered, the user should click "Register Now" to register their credentials in the system
In this section, the user will register or activate their Facebook or Google Account to access the mobile app.
If the user doesn't want to register with either Facebook or Google, they can sign-up by inputting their Name, Email, and Password.
The user will click the Register button to complete the registration.
MOBILE APP
How to Check Risk Analysis
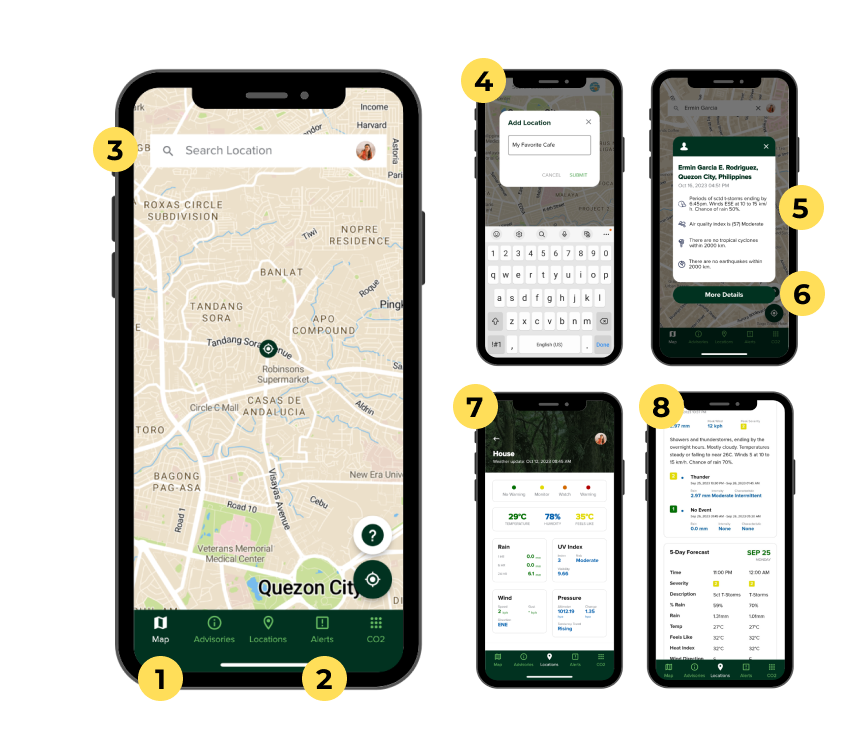
This Map Option presents the specific locations in Quezon City. If the user click one location, it will display the specific parameters.
This Alerts Option presents the latest weather information, such as flooding, lightning, 6hr weather and more.
This Search Bar can be used to search specific locations in the map.
This Add Location Option, you can add specific location, (e.g. Home, Work, School).
After adding, it will present the brief weather conditions in your location
This More Details will present more comprehensive details of your preferred location.
If you click the More Details option, this will display. It will show the weather now such as temperature, humidity, feels like (heat index), and more.
If you scroll it, the 6-Hour Forecast will show up. It displays all significant weather parameters to prepare for the next 6 hours. Moreover, this section also display the 5-Day Forecast and Lifestyle Impact.
In the last section, the latest earthquake information will display.
MOBILE APP
How to Set Early Warning Alerts and View PAGASA Advisories
The Alert Section enables the user to be alerted by the app for the next 6 hours using the different weather parameters.
The Dropdown in the Alert section displays the different parameters available in the chosen location (between QC City Hall and Districts 1 to 5) such as Lightning, Dangerous Thunderstorm, 6Hr Weather (Nowcast), Heat Index, PAGASA Tropical Cyclone Distance, Mosquito Activity, and PAGASA GFA and TC Advisory.
These Weather Alerts and Forecasts offer the detailed information of the certain location including the warning alert, distance information, and expected rain chance.
The Advisories Section enables the user will to the advisories from the National Weather Agency (PAGASA) regarding the General Flood Advisory and Tropical Cyclone Advisory issued.
Advisories shows the reports from PAGASA-DOST regarding the issued General Flood Advisory and Tropical Cyclone Advisory.

MOBILE APP
(New Feature) CO2 Section
The Carbon Footprint section provides an in-app calculation of the user’s carbon footprint based on the user’s demographics, electricity bills, water bill,
user’s way of commuting to work, office distance, and commute budget, and if the user is working at home or not.
In this section, the user can see the hazard and risk
maps of different Barangays in Quezon City.
This provides an insight to the residents of Quezon
City about the range of the possible effect and/or it
illuminates the areas or vulnerable part to a
particular hazard.
In this section, the feeds sections are generated by using the Feed CMS Section of the IRISEUP Web App in which the admin can create a content in the feeds for announcement and other things related to the DRRM initiatives.
In this section, the monthly report provides a visualization of the data that was inputted in the Carbon Footprint section.
Currently, it is not available as the system needs to collect sufficient data.

MOBILE APP
How to compute for your carbon footprint
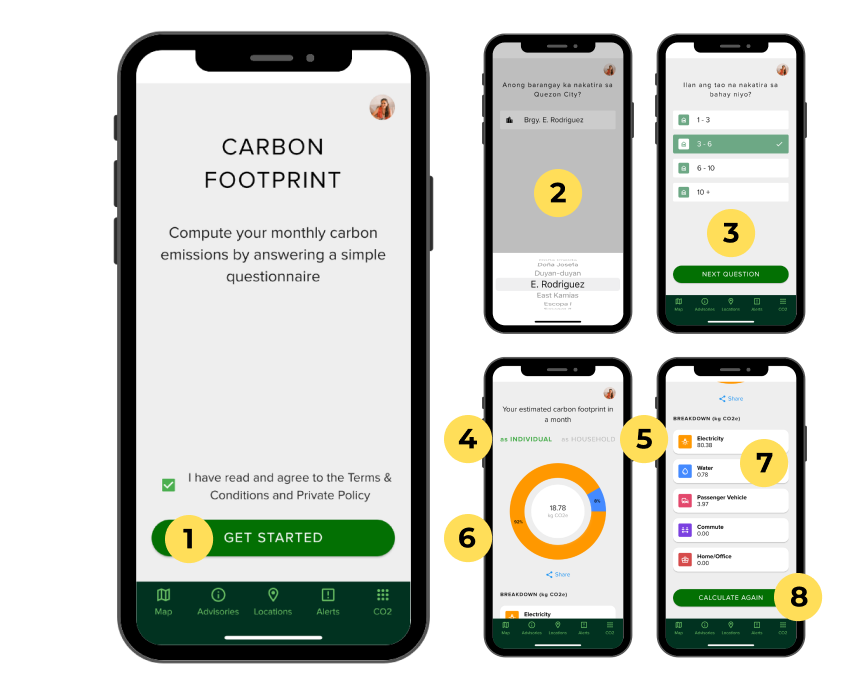
Open the app sidebar and select "Carbon Footprint." Click "Get Started.”
Choose your barangay from the selector for location-specific insights.
Answer questions in our carbon footprint questionnaire. Once complete, the system will compute your emissions and present a detailed overview.
Select “As Individual” to view a breakdown of your individual emissions based on the following parameters:
- Electricity
- Water
- Passenger vehicle
- Commute
- Work at home or office
To view your total household footprint, select “As Household.” View a breakdown of your household emissions based on the following parameters:
- Electricity
- Water
Get a better view of your total carbon footprint, both as an individual and as a household, through the Footprint Graph.
Access a detailed breakdown of your individual and household emissions.
Click "Calculate Again" to answer a new questionnaire and recalculate your carbon footprint.
DOWNLOAD NOW
RISE UP for a climate-ready QC
Get the I RISE UP app for your mobile device and stay updated with real-time information and alerts.
